11. Exercise 3
Exercise 3
Exercise 3: How many ways can you visualize it?
I want you to visualize the cost of a festival ticket for the full 3-days vs. a single day pass. The 3-day pass is $287 and the 1-day is $166
Have fun with this. If you feel you need help getting the creative juices flowing visit some of the resources listed below to view a lot of possible options.
Resources for ideas:
- Information is Beautiful Awards. Annual awards for the most beautiful vizzes of the year.
- Reddit: Data is Beautiful. Collection of data, graphs, chars, maps, etc…
- Tableau Public Gallery. For the best of the best go to the Greatest Hits section.
- The R Graph Gallery. Graphs made with R.
- Xenographics. Unusual charts and maps. Repository of novel, innovative, and experimental visualization to help inspire
- Dribbble.
- Behance.
Exercise 3 solution
Additional Resources:
- Blog on graphic continuum
- Here is a Medium article talking about visual encodings in a bit more detail.
Solution
This is an example of a few sketches I might experiment with. I sketch a few visuals and explain how they are meant to encourage festival goers to purchase a 3-day pass over a single day.
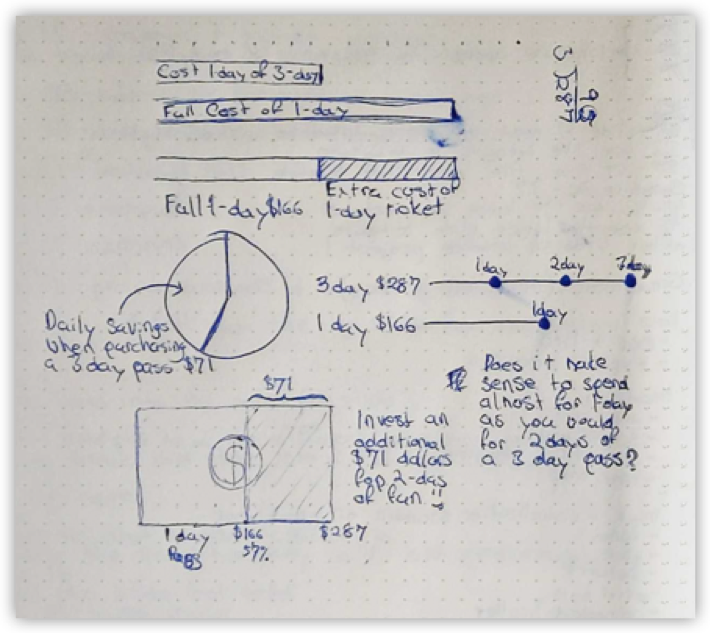
Bar chart comparing a ⅓ of the 3-day ticket to a 1-day pass.
Stacked bar chart emphasizing the extra cost of a 1-day pass vs. ⅓ of the 3-day pass.
Pie chart pointing out the savings you realize for a single day when purchasing a 3-day pass vs the 1-day pass.
A sort of bar chart with points comparing the full 3-day ticket price to the 1-day to show the slight extra amount you’d have to spend to get 3 days at the festival instead of 1
A 100% stacked bar that looks like a dollar bill encouraging people spend the extra $71 and look at it as an investment in their fun.